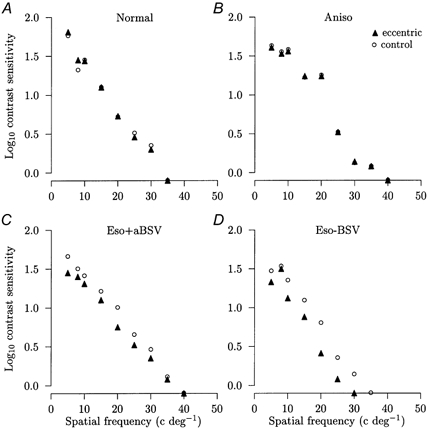
Figure 5. Dichoptic viewing experiments.

Comparisons of the logarithm contrast sensitivities against the spatial frequency of the sinusoidal grating pattern display between normal monocular viewing of the display with the better or non-amblyopic eye and foveal viewing of the green LED in the other eye (○ in A-D) and monocular viewing of the display with the better or non-amblyopic eye and foveal viewing of the green LED together with eccentric viewing of the grating display by the other eye (▴ in A-D). The percentage difference as a result of additionally viewing the eccentric display (ECC) is given for each subject. A, normal subject: ECC = +2 % (not significant). B, anisometropic amblyope: ECC = −1 % (not significant). C, esotropic amblyope with anomalous BSV: ECC = −25 % (P < 0.01). D, esotropic amblyope without BSV: ECC = −33 % (P < 0.01). The s.e.m. is smaller than the symbol size and symbols falling on the x axis denote that that spatial frequency was not detected.
