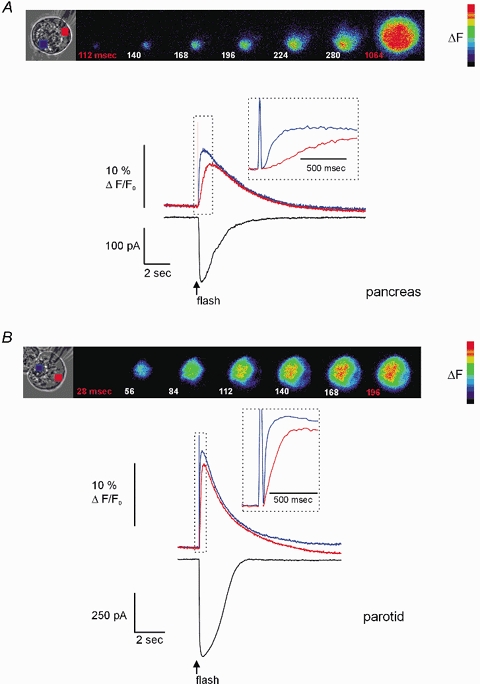
Figure 1. Effect of flash photolysis of caged-InsP3 in PAC and PAR.

A, PAC, shown in brightfield, was loaded via the patch pipette with 3 μm caged-InsP3 and 75 μm OGB-2. Pseudocoloured digital fluorescence images at the indicated times are shown in series and reflect the Δ[Ca2+]c, evoked by flash photolysis delivered throughout the entire image plane. The Δ[Ca2+]c was initiated ∼112 ms after the flash in a region within the extreme apical pole of the cell. The [Ca2+]c becomes global in ∼1 s after photolysis. Upper traces depict the Δ[Ca2+]c initiated by photolysis. The blue trace was taken from a region of interest (ROI) within the luminal region and the red trace was from a ROI in the basal pole of the cell. Inset shows the rising phase of the response indicated by the hashed box on an expanded time scale to illustrate the delay between the initiation of the apical and basal signal. The lower black trace shows the IClCa activated by Δ[Ca2+]c. Note the high temporal coincidence with the apical [Ca2+]c signal. B, PAR shown in brightfield was subjected to an identical experimental paradigm. The pseudocoloured images show that a [Ca2+]c signal is again initiated in the extreme apical portion of the cell after a short latency (∼1 image frame) and in contrast to PAC within 200 ms becomes a global signal. The traces illustrate the apical [Ca2+]c (blue trace), basal [Ca2+]c (red trace) and corresponding IClCa (black trace) evoked by flash photolysis. Cells were held at −20 mV and external NaCl and KCl were replaced with TEA-Cl.
