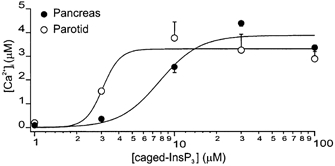
Figure 2. Concentration vs. response relationships for the Δ[Ca2+]c evoked by flash photolysis of caged-InsP3 in PAC and PAR.

Peak Δ[Ca2+]c (in μm) evoked by photolysis of different concentrations of caged-InsP3 plotted from ROIs at the apical zone of PAC (•) and PAR (○). Flash photolysis induced changes in apical [Ca2+]c with peak amplitudes of 198 ± 24, 1523 ± 28, 3765 ± 674, 3251 ± 677 and 2887 ± 576 nm (PAR, 4 ≤n≥ 17) and 96 ± 2, 357 ± 29, 2538 ± 233, 4383 ± 126 and 3360 ± 171 nm (PAC, 4 ≤n≥ 8). Data for 1 and 3 μm caged-InsP3 were obtained using the high-affinity dye OGB-2; and for 10–100 μm caged-InsP3, the low-affinity dye OGB-5N was used. Lines represent Hill plot fits to the data.
