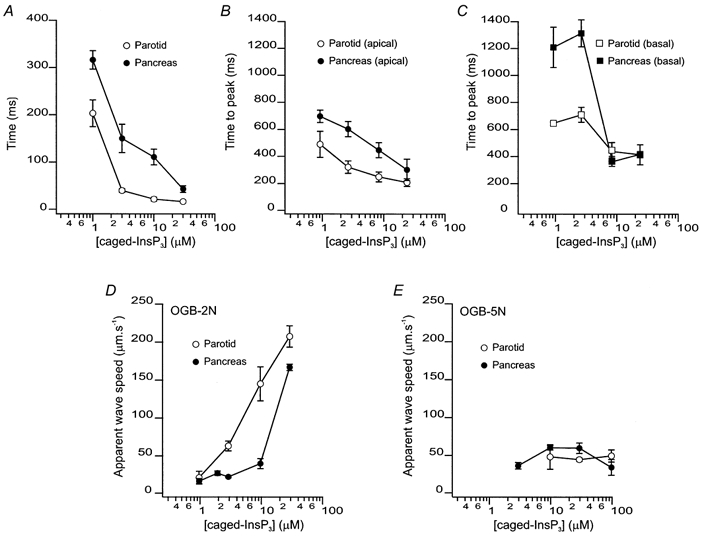
Figure 3. Characteristics of [Ca2+]c signals evoked by flash photolysis of caged-InsP3 in PAC and PAR.

A, latency before a detectable Δ[Ca2+]c following photolysis of caged-InsP3 in PAC (•) and PAR (○). The mean latencies for 1, 3, 10 and 30 μm caged-InsP3 in PAC were 316 ± 20, 150 ± 30, 111 ± 17 and 43 ± 7 ms (4 ≤n≥ 10). The mean latencies for 1, 3, 10 and 30 μm caged-InsP3 in PAR were 203 ± 28, 40 ± 4, 22 ± 4 and 17 ± 3 ms (5 ≤n≥ 17). The latency was significantly shorter in PAR at all concentrations of caged-InsP3. B, time-to-peak Δ[Ca2+]c following photolysis determined from ROIs in the apical zone of PAC (•) and PAR (○). The time-to-peak was significantly shorter in PAR when compared with PAC. C, corresponding data illustrating time-to-peak determined from ROIs from the basal region of PAC (•) and PAR (□). Data illustrate that at all concentrations of caged-InsP3 utilized a rapid global wave is initiated in PAR, whilst only higher concentrations exhibit this property in PAC. D, apparent wave speeds measured with OGB-2 upon photolysis of caged-InsP3 on PAC (•) and PAR (○). Apparent wave speed increased in a concentration-dependent fashion in PAR, but remains relatively constant in PAC until high concentrations of caged-InsP3 are photolysed. E, apparent wave speeds measured with OGB-5N upon photolysis of caged-InsP3 on PAC (•) and PAR (○). Wave speed remains constant in both PAR and PAC at all [caged-InsP3] tested.
