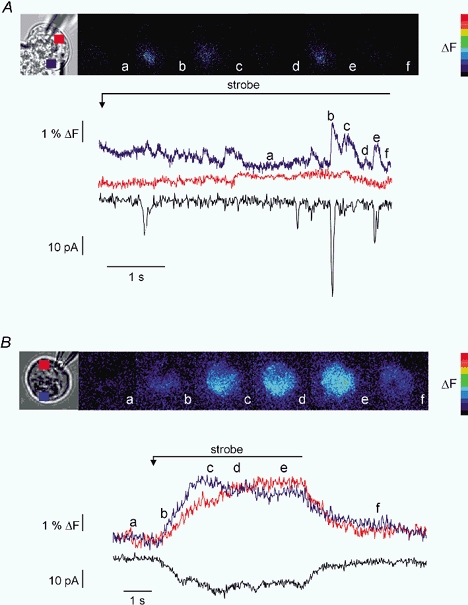
Figure 4. Threshold release of InsP3 in PAC and PAR.

Continuous, low-level photolysis was used to uncage threshold-activating levels of InsP3 in PAC and PAR. A, PAC was loaded with 10 μm caged-InsP3 and 75 μm OGB-2. The pseudocolour panel shows images taken at the times indicated by the corresponding letters on the trace and images. Low-level photolysis evokes highly localized, transient increases in [Ca2+]c reminiscent of ‘puffs’ or ‘blips’. These increases in [Ca2+]c only occur in the apical region of the cell and the larger increases are generally coincident with activation of IClCA (increases in IClCA activity in the absence of [Ca2+]c may be the result of [Ca2+]c changes above/below the focal plane). Traces show the temporal data for a ROI in the apical region (blue trace) the basal region (red trace), which shows no increase, and corresponding IClCa (black trace). B, PAR shown in brightfield was subjected to an identical experimental paradigm. The images demonstrate that although the signal is initiated in the apical zone it becomes global rapidly. The traces illustrate the apical region (blue), basal region (red) and IClCa (black) resulting from the photolysis.
