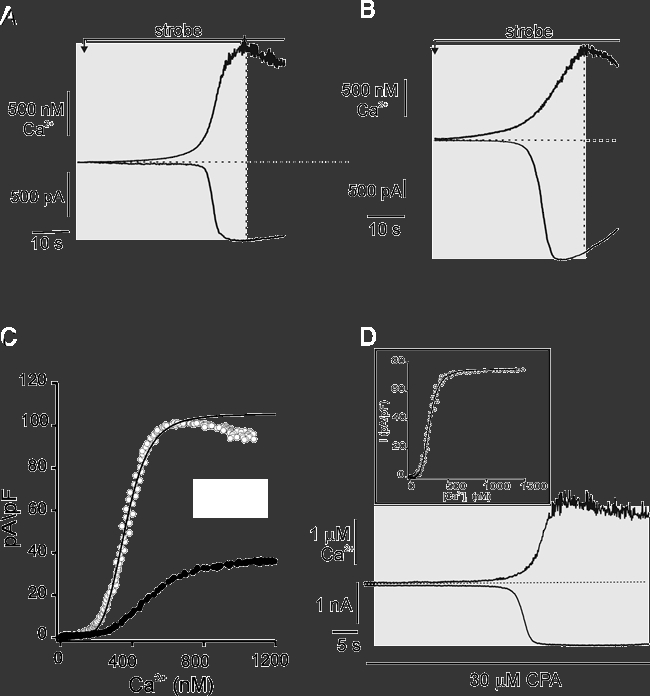
Figure 7. Determination of the Ca2+ sensitivity of ClCa during dynamic changes in [Ca2+]c using the [Ca2+]c-ramp method.

Representative changes in [Ca2+]c (upper traces) and corresponding IClCa (lower traces) in PAC (A) and PAR (B) induced by the continuous, low-level strobe photolysis of caged-Ca2+. Cells were held at −20 mV. C, plots of the instantaneous, single-cell Δ[Ca2+]c-I responses for PAC (filled symbols) and PAR (open symbols) from A and B.[Ca2+]c and IClCa traces within the shaded regions of cells in A and B were time-matched, and values at 100 ms intervals were related. Currents were inverted and normalized to whole-cell capacitance. Continuous lines are fits to the Hill equation. The KD values for PAC and PAR were estimated to be 500 nm and 360 nm, respectively. D, changes in [Ca2+]c and current in PAR was induced by Ca2+ ramp as in A and B. Treatment with 30 μm cyclopiazonic acid (CPA) largely abolished the apparent inactivation of the IClCa. Cells were held at −20 mV. Inset shows the corresponding time-matched, instantaneous concentration-response relationship for the CPA-treated cell in A. The KD value was estimated under these conditions to be 204 nm.
