
Figure 1. Spontaneous rhythms of synaptic origin.
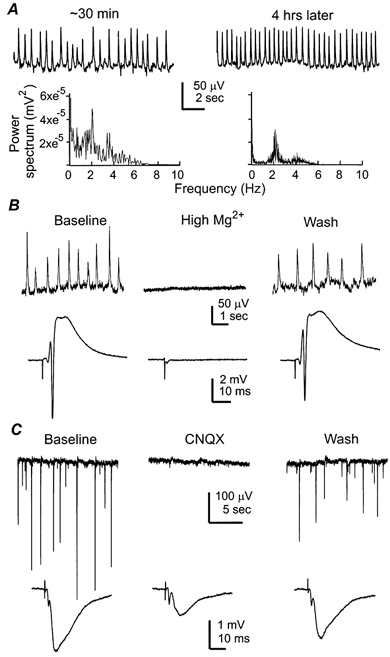
Data in A-C were collected from three separate experiments. A, rhythmic field potentials sampled from CA1 somatic area of a 25-day-old mouse hippocampal isolate. Left and right, responses collected at ∼30 min after placing the tissue isolate in the recording chamber and ∼4 h later, respectively. The corresponding power spectrum plots were shown below. In a set of five hippocampal tissues examined, the rhythms were 2.38 ± 0.15 and 2.04 ± 0.25 Hz measured after perfusion (at 32°C) for ∼30 min and 4 h. B, spontaneous rhythmic field potentials (top) and evoked synaptic field potential (bottom) sampled from the CA1 somatic area of a 26 days old mouse hippocampal isolate. Representative responses were collected before, during perfusion of a high Mg2+ ACSF (5 mm, ∼7 min) and after washing out high Mg2+. The evoked potentials were induced by constant Schaffer collateral stimulation every 15 s and each illustrated trace was an average from three consecutive responses. C, spontaneous rhythmic field potentials (top) and evoked field EPSPs (bottom) were recorded from the CA1 dendritic area of a 28 days old mouse hippocampal isolate. Representative responses were collected before, at the end of CNQX perfusion (1 μm, ∼8 min) and after washing out CNQX. The evoked responses were similarly illustrated as in B.