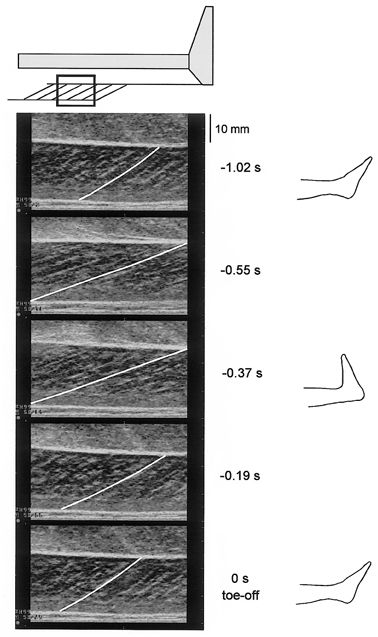
Figure 2. Serial ultrasonic images of the medial gastrocnemius muscle under CM conditions.

The muscle belly of the medial gastrocnemius was scanned (top). The fascicles of the gastrocnemius (the line in each image was drawn along the fascicle in the centre of image) can be seen between the superficial (proximal) and deep (distal) aponeuroses (white horizontal echoes). The images were recorded at 65 Hz. In this figure, serial images were curtailed and arranged sequentially, the value to the right of each image shows the time before toe-off (end of movement). To the far right images of the foot position in relation to the recordings are also shown. It can be seen that fascicle length is longest at transition from dorsiflexion to plantar flexion.
