
Figure 3. Acceleration of EPSPs by development.
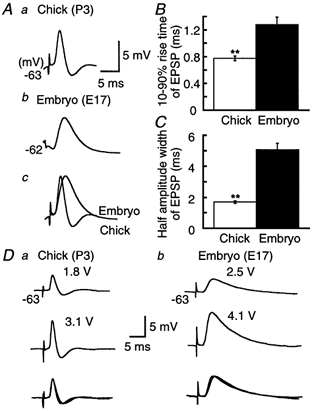
A, ensemble averages of EPSPs. Averaging was made of 16 traces for the chick (a), and 13 traces for the embryo (b), from the fourth EPSP of the train which failed spiking at coincident stimulation (Δt = 0 ms) in Fig. 1A. Time and amplitude calibrations are for a and b. c, traces in a and b were amplitude scaled and superimposed. Ten to ninety per cent rise time (B) and half-amplitude width (C) of EPSP in the chick and the embryo. Measurements were made after taking ensemble averages of 5–20 EPSPs in each cell at the fourth stimulus in the train evoked by coincident stimuli (9 chick neurons and 6 embryonic neurons, from the same set of cells as presented in Fig. 2). Here and in subsequent figures, **P < 0.01 (Student's unpaired t test). D, EPSPs induced by the threshold intensity to evoke the synaptic transmission (top) and the intensity just below generation of action potentials (middle) in the chick (a) and the embryo (b). Five records were averaged for each trace. The stimulus intensity is indicated above each trace. Each pair of traces has been amplitude scaled and superimposed (bottom).