
Figure 7. Effects of K+ channel blockers on action potentials.
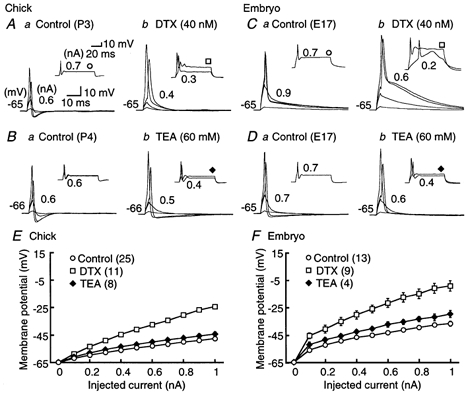
A-D, four superimposed voltage records in response to the short 3 ms current injection in the chick (A and B) and the embryo (C and D); voltage responses generated by 0.1 nA current injection, just below threshold intensity, threshold intensity (indicated in each panel), and 1.0 nA. The insets show two superimposed voltage records in response to the long 70 ms current injection of the threshold intensity and 0.7 nA. The threshold current is indicated near the inset. Here and in Fig. 8A-F, the membrane potential was maintained at around −65 mV by current injection. A and C show the chick and embryo responses to control (a) and DTX (40 nm, b); B and D show the chick and embryo responses to control (a) and TEA (60 mm, b). DTX eliminated after-hyperpolarization, augmented the peak and decelerated the falling phase of action potentials. E and F, current-voltage relations measured at the pulse end of a 70 ms current injection in the chick (E) and the embryo (F). Open circles, control; open squares, DTX; filled diamonds, TEA. The input resistance was significantly increased by DTX in both age groups. The number of cells tested is indicated in parentheses in this figure and in Fig. 8I-J. In the chick the symbol size exceeds the size of the error bars (s.e.m.).