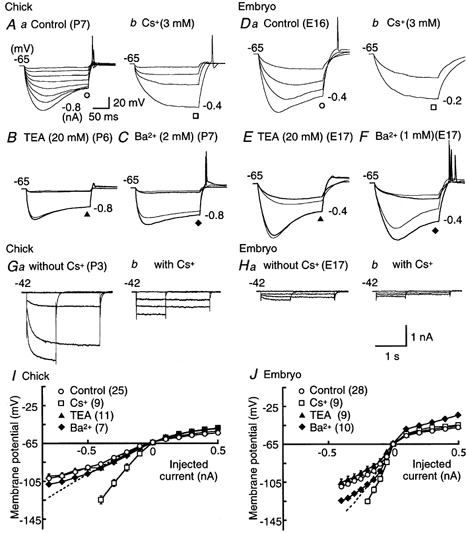
Figure 8. Hyperpolarization-activated current-induced potential sags.

A and D, control (a) and effects of Cs+ (3 mm, b) on voltage responses. Membrane hyperpolarization was induced by 200 ms current injections administered in 0.1 nA increments to the current level indicated in each panel, in the chick (A) and the embryo (D). B and E, control (thin traces) and effects of TEA (20 mm, thick traces) on hyperpolarizing responses in the chick and the embryo, respectively. Membrane hyperpolarization was induced by 200 ms current injections of −0.1 nA at the intensity indicated to the right of each panel. C and F, control (thin traces) and effects of Ba2+ (2 mm in the chick and 1 mm in the embryo, thick traces) on hyperpolarizing responses induced as in B and E. G and H, series of current traces recorded under voltage clamp conditions, in response to hyperpolarizing voltage pulses before and after application of 3 mm Cs+, in the chick and the embryo, respectively. Recordings were made in the artificial cerebrospinal fluid supplemented with 1 mm Ba2+, 0.5 mm 4-aminopyridine, 1 mm TEA, 200 μm Cd2+, and 1 μm TTX. Hyperpolarizing voltage pulses of either 2.5 or 1 s duration were applied from the holding potential of −42 mV in 30 mV steps. A 1 s pulse was applied to −132 mV because a 2.5 s pulse frequently killed the cells. The amplitude of Cs+-sensitive current was about 5 times larger in the chick than in the embryo (1.23 ± 0.10 nA (n = 11) and 0.24 ± 0.03 nA (n = 4), respectively, when measured at the pulse end to −132 mV; P < 0.01, Student's unpaired t test). I and J, current-voltage relations measured at the pulse end of a 200 ms current injection under current clamp conditions, in the chick and the embryo, respectively. Open circles, control; open squares, Cs+; filled triangles, TEA; filled diamonds, Ba2+. Dashed lines indicate peak voltage responses in control. Note that Cs+ removed the sags and increased the input resistance at hyperpolarization, while the sags were not affected by TEA and Ba2+ in either age group.
