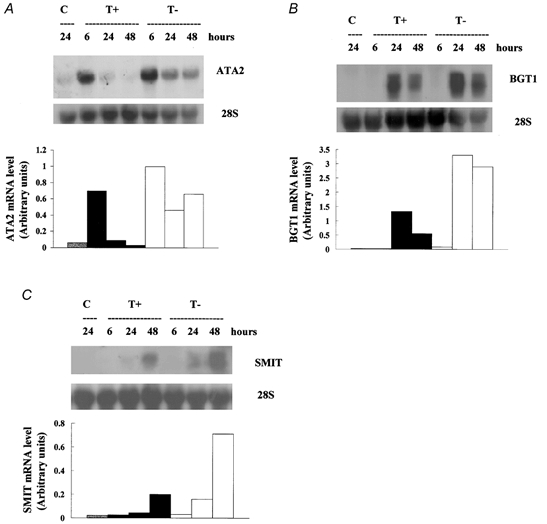
Figure 8. Modulation of expression of mRNA for ATA2, BGT1 and SMIT induced by hypertonicity.

Endothelial cells were incubated in isotonic (0.3 osmol (kg H2O)−1) medium (C) and depleted hypertonic (0.5 osmol (kg H2O)−1) medium with (T+) or without (T-) added betaine and myo-inositol, each at 0.1 mmol l−1. After the indicated times, total cellular RNA was extracted and analysed by Northern blotting for (A) ATA2, (B) BGT1 and (C) SMIT mRNA, as described under Methods. 28S rRNA was used for standardisation, the densitometric quantification of the blots being normalised to the levels of 28S rRNA.
