
Figure 2. Concentration-response curves shows altered pharmacological properties when co-expressing α7 and β2 subunits.
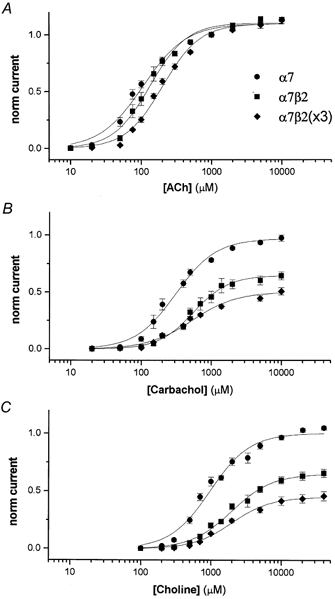
The concentration-response curves for activation by ACh, carbachol and choline are shown in A, B and C, respectively. Each point represents the average (3–6 cells) from data normalized (see Methods) to the amplitude of 1 mm ACh. The traces are one-component Hill fits (see Methods) to the averaged data.