
Figure 1. Different sequences of membrane potential change recorded from cells lying in the mouse gastric antrum.
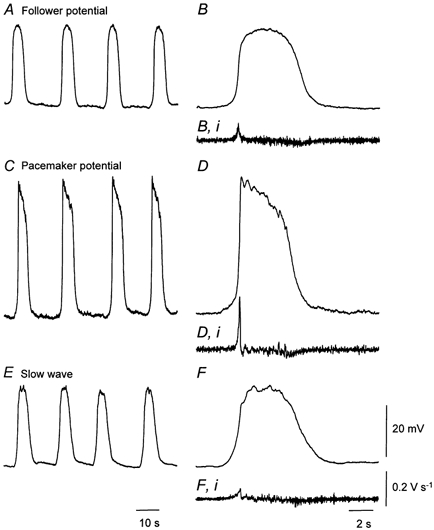
A and B, recordings of follower potentials, displayed on two different time bases. The resting membrane potential was −65 mV. C and D, pacemaker potentials recorded from the same preparation again displayed on two different time bases. The resting membrane potential was −68 mV. E and F, slow waves, again recorded from the same preparation and again displayed at two scan speeds. The differentiated membrane potential change, dV/dt is shown below each of the expanded responses, The resting membrane potential was −67 mV. The physiological saline contained nifedipine, 1 μm. The left-hand time calibration bar applies to the column of recordings shown on the left; the right-hand time calibration bar applies to the column on the right. The voltage calibration bar applies to all voltage recordings and the dV/dt calibration bar to each differentiated recording.