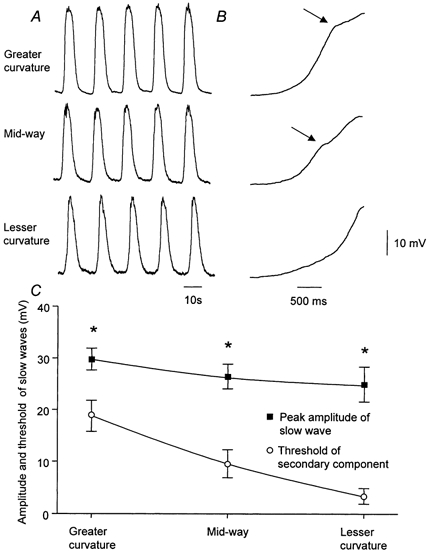
Figure 2. Slow waves recorded from the greater curvature, midway between greater and lesser curvature and from the lesser curvature.

A, slow waves recorded from the greater curvature, midway and lesser curvature of the mouse gastric antrum. The resting membrane potentials were −68 mV, −65 mV and −69 mV respectively. B, the rising phases, displayed on rapid time base, of sample slow waves recorded at each location. The voltage calibration bar applies to all traces, the left-hand time calibration bar applies to A, the right-hand time calibration bar to B. The grouped observations from the experimental series are shown in C. * Experimental observations differed significantly.
