
Figure 2. Density of IK1 in guinea-pig ventricular cells measured using perforated-patch recordings.
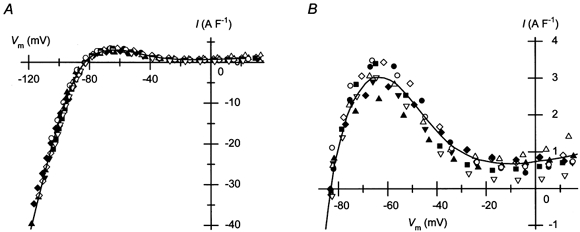
A, I–Vm relationships of the currents obtained as described in Fig. 1 from different cells. Current amplitudes are expressed as relative to the cell capacitance. The capacitance of the ventricular cells used to obtain the data was 150 ± 11 pF (n = 9). The continuous curve indicates the average relationship. B, outward-current density in the physiological voltage range. The plot shown in A was expanded. The continuous line is the average relationship also shown in A.