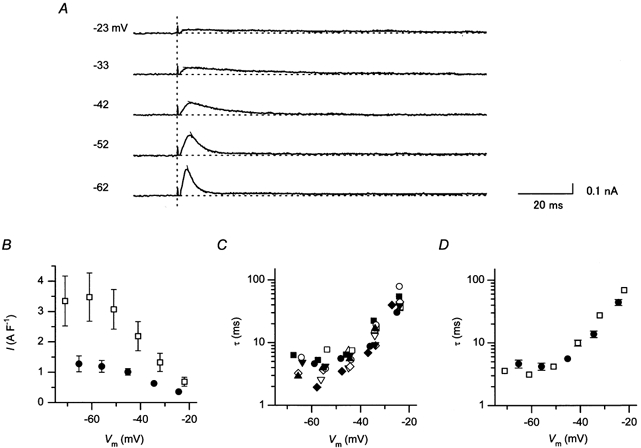
Figure 4. Time and voltage dependences of the outward IK1 transient, as observed by perforated-patch recordings.

A, isolated transient components of the outward IK1 observed during repolarizing voltage steps. Transient currents were evoked using a hyperpolarizing pre-pulse, as illustrated in Fig. 3A (left), and were isolated by digitally subtracting the sustained current components recorded using a depolarizing pre-pulse (Fig. 3A, right). The vertical dotted line indicates the time points when repolarizing steps were given. The numerals on the left of each trace indicate VP at the repolarizing pulses. Fits of a single exponential curve to the decaying phase of the current components are also given. B, peak amplitudes of the transients plotted against Vm during repolarizing voltage steps. Plotted are the data obtained by perforated patch using a 200 ms depolarizing pulse to +37 mV (•, n = 5), and those by the ruptured patch using a 100 ms depolarizing pulse to +30 mV (□, n = 7). The pipette solution used in ruptured-patch recording contained about 1 mm free Mg2+ and no polyamines. The values are the mean values, and the vertical lines indicate s.e.m. The s.e.m. is not shown where the value was smaller than the symbol. C, time constants of the decaying phase of the outward IK1 transients. Data obtained from 10 perforated-patch experiments are plotted against Vm at the repolarizing steps. Different symbols indicate different experiments. D, comparison of the decay time constants obtained by perforated patch clamp (•) and by ruptured patch clamp (□). The mean values are shown (perforated patch, n = 10; ruptured patch, n = 8).
