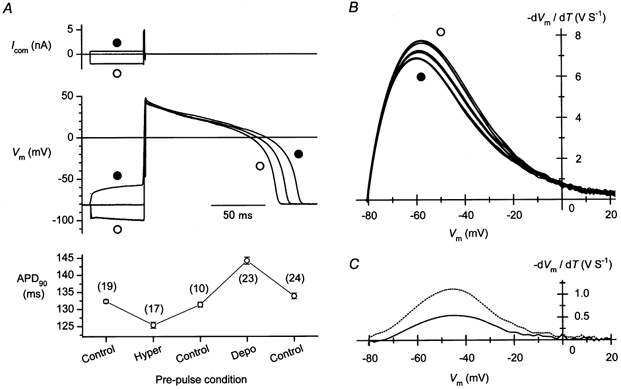
Figure 5. Effects of a hyperpolarizing or a depolarizing pre-pulse on AP duration (APD) and the net current density during AP repolarization.

A, changes in the APD observed using a depolarizing (•) or hyperpolarizing (○) current pre-pulse. Command pulses (5 nA, 0.9 ms) without or with a pre-pulse of appropriate amplitude were applied continuously at 1 Hz to elicit APs. The same pre-pulse condition was used for about 30 s to record APs. The pre-pulse condition was changed chronologically in the following order: ‘without a pre-pulse’ (Control), ‘with a hyperpolarizing pre-pulse’ (Hyper), Control, ‘with a depolarizing pre-pulse’ (Depo) and Control. Representative AP records observed at each pre-pulse condition are shown. The plot in the bottom panel shows APD90 at each pre-pulse condition. Each symbol represents the mean ± s.e.m. The number of records analysed to obtain the data is indicated in parentheses. B, phase-plane diagrams obtained from the repolarization phase of the APs. The -dVm/dt values calculated from the APs are plotted against Vm. Five representative relationships are shown for each pre-pulse condition. APs were digitally filtered at 200 Hz before calculation. Note that the unit V S−1 is equivalent to A F−1. The amplitude of the outward current decreased with the depolarizing (•) and increased with the hyperpolarizing (○) pre-pulse. C, changes in the current density at the repolarization phase caused by using pre-pulses. Shown are the difference between -dVm/dt (net current density)-Vm relationships obtained with depolarizing (•) and hyperpolarizing (○) pre-pulses (dotted line), and that between the relationships obtained with and without a depolarizing pre-pulse (continuous line).
