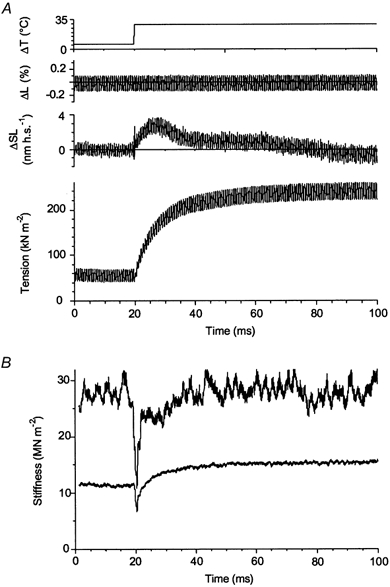
Figure 8. Stiffness changes in a muscle fibre during a tension transient induced by a 23.5 °C T-jump.

A, traces (from top to bottom) are: fibre temperature, changes in total fibre length, changes in sarcomere length and tension. Sinusoidal oscillations in fibre length had a frequency of 1.5 kHz. Sampling rate was 40 kHz per channel. B, upper and lower traces are time courses of fibre stiffness (SSL and STL) during the temperature-induced transient obtained with normalization for changes in sarcomere length and total fibre length, respectively. Procedure of stiffness measurement is described in the text. Fibre dimensions: 1.96 mm × 5030 μm2, sarcomere length 2.44 μm.
