
Figure 9. Amplitude and phase analysis of the tension and sarcomere length traces shown in Fig. 8A.
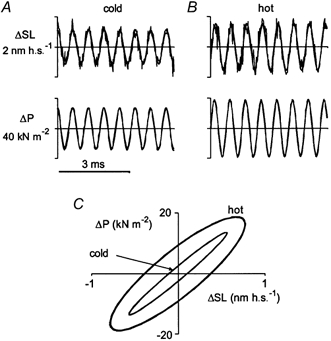
In A and B, 5 ms fragments of changes in sarcomere length and tension induced by 1.5 kHz sinusoidal oscillations in fibre length recorded during steady-state contraction at low (A, ∼6 °C; fourth to ninth millisecond) and high (B, ∼30 °C; nintieth to ninty-fifth millisecond) temperature were fitted with sinusoidal functions. Average tension was 55 kN m−2 in A and 240 kN m−2 in B. In C, Lissajous plots of the fitted changes in tension (ΔP) and in sarcomere length (ΔSL) at low and high temperature are drawn. Amplitudes of sinusoidal oscillations in sarcomere length were 0.57 and 0.78 nm h.s.−1 for A and B, respectively. Amplitudes of tension oscillations and apparent stiffness (SSL) were 13.7 kN m−2 and 28.7 MN m−2 at low temperature (A) and 18.8 kN m−2 and 29.6 MN m−2 at high temperature (B), respectively. The phase shift between changes in sarcomere length and tension was 0.19 rad for A and 0.51 rad for B.