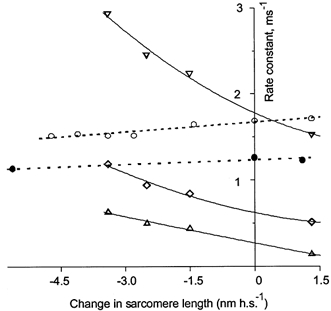
Figure 11. Strain dependence of the rate constants for the length step- and the T-jump-induced tension transients shown in Fig. 10A on the amplitude of the preceding length steps.

Rate constants k1 (▿) and k2 (▵) were extracted from two-exponential fit while apparent rate constant kapp (⋄) was obtained from monoexponential fit of the length step responses. The time course of the T-jump response is characterized by reciprocal halftime, 1/t0.5 (○, •), multiplied by 10 to see all points on the same plot. The open symbols relate to the fibre of Fig. 10A, while closed symbols relate to the fibre of Fig. 10B. The dashed lines are linear regressions through the data points for 1/t0.5. The continuous lines show parabolic regressions for k1, k2 and kapp.
