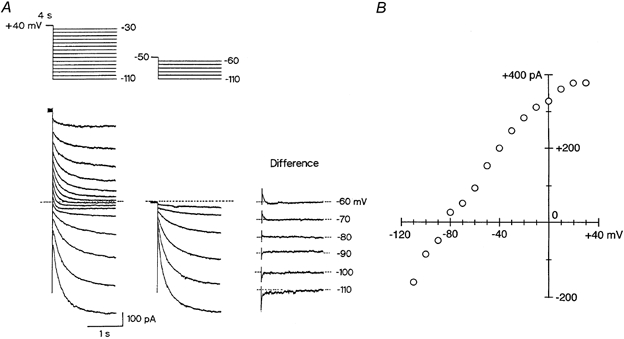
Figure 6. Conductance properties of IKs in guinea-pig SA node cells.

A, cell was depolarized from a holding potential of −50 mV to +40 mV for 4 s to activate IKs, and then repolarized to various test potentials between +30 and −110 mV in 10 mV steps (left-hand panel). The same cell was repolarized from the −50 mV holding potential to membrane potentials between −60 and −110 mV without the depolarizing pulse (middle panel). IKs tail current elicited on return to the test potentials between −60 and −110 mV after a 4 s depolarizing pulse to +40 mV was determined by subtracting the membrane current without the depolarizing pulse to +40 mV from that with the depolarizing pulse (right-hand panel). A schematic diagram of the voltage protocol is given above the current traces. These recordings were conducted in the presence of 5 μm E-4031 to inhibit IKr. The dashed line indicates the zero current level. B, amplitude of the IKs tail current at each test potential was divided by the expected decrease in the activation variable and then plotted as a function of membrane potential.
