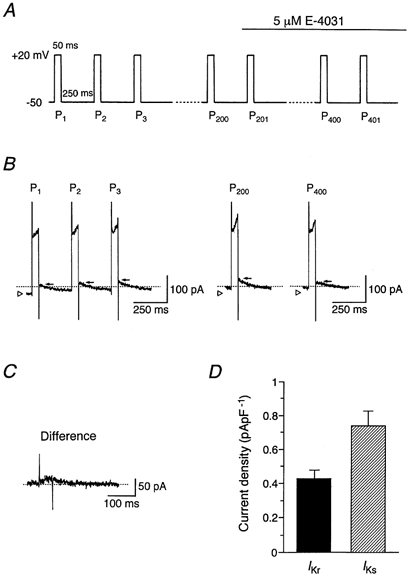
Figure 10. Comparison of tail current amplitude of IKr and IKs.

A, pulse protocol. Depolarizing pulses of 50 ms were applied to +20 mV from a holding potential of −50 mV at a rate of 200 pulses min−1. After an SA node cell was subjected to a train of successive depolarizing pulses for 1 min (200 pulses), 5 μm E-4031 was added to the bath, as marked by the horizontal bar. B, IK at P1 (first pulse), P2 (second pulse), P3 (third pulse), P200 (two hundredth pulse) and P400 (four hundredth pulse). The open triangle indicates the current level before applying the pulse train and the arrow denotes the peak level of IK tail current. The zero current level is indicated by the dashed line. C, IKr obtained by digital subtraction of IK after 1 min exposure to E-4031 (IK at P400) from that before its exposure (IK at P200) (shown in B). D, amplitudes of tail currents of IKr and IKs (n = 4), determined during successive depolarizations (shown in A). The amplitude of IKr tail current was measured from IKr obtained as shown in C. The magnitude of IKs tail current was determined from IK at P400 by subtracting the current level before applying the pulse train (denoted by open triangle) from the peak of tail current (indicated by arrow). The current amplitudes were normalized with reference to cell capacitance. Columns and bars represent the means and s.e.m., respectively, and the amplitude of IKs was significantly larger than the amplitude of IKr (Student's paired t test).
