
Figure 1. Conditioning of forelimb EMG responses in the awake cat.
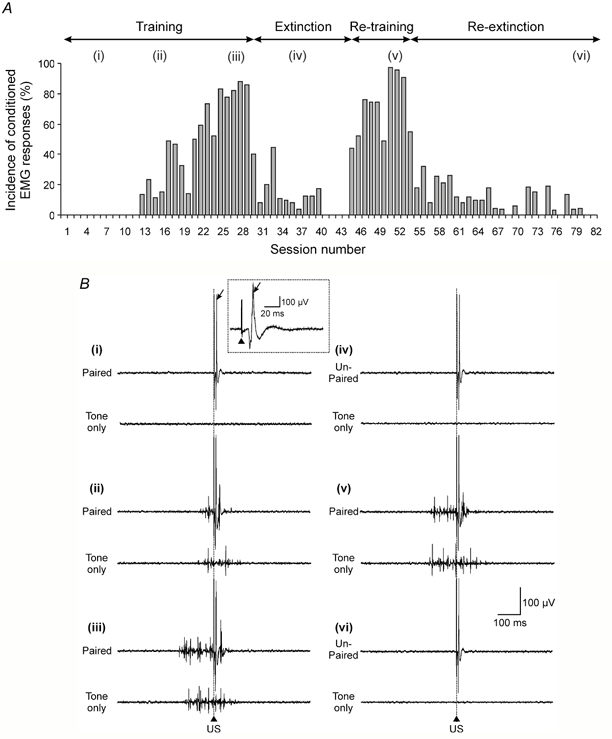
A, bar chart plotting the incidence of conditioned forelimb EMG responses in the ipsilateral cleidobrachialis muscle (ClB) for each recording session (animal CE2) during an initial period of conditioned stimulus (CS)-unconditioned stimulus (US) paired trials (training; i.e. trials when the US occurs at CS offset), followed by a period of CS-US unpaired trials (extinction, i.e. trials when the US occurs at a variable time 5-25 s after CS offset), and during a second period of re-training and re-extinction (based on 45 paired or unpaired trials per session during training and extinction, respectively). B, example EMG traces from ClB for sessions corresponding to those indicated by lower-case roman numerals in A. The upper and lower traces in each pair display the EMG activity in an example CS-US (paired or unpaired) trial and an example CS (tone only) trial, respectively. The EMG traces were obtained (i) during the early stages of the first training period (the arrow indicates the unconditioned response, and in the inset the same response on an expanded time base, while the arrowhead indicates the paired pulse stimulus artefact), (ii) when conditioned responses were beginning to occur, (iii) when conditioned responses were fully acquired, (iv) after a period of extinction, (v) when conditioned responses were re-acquired and (vi) after a second period of extinction. The vertical dotted line and arrowhead indicate the time of offset of the 500 ms CS in paired and tone only trials and time of onset of the US in paired and unpaired trials. See Methods for further details.