
Figure 2. Changes in climbing fibre field size during conditioning.
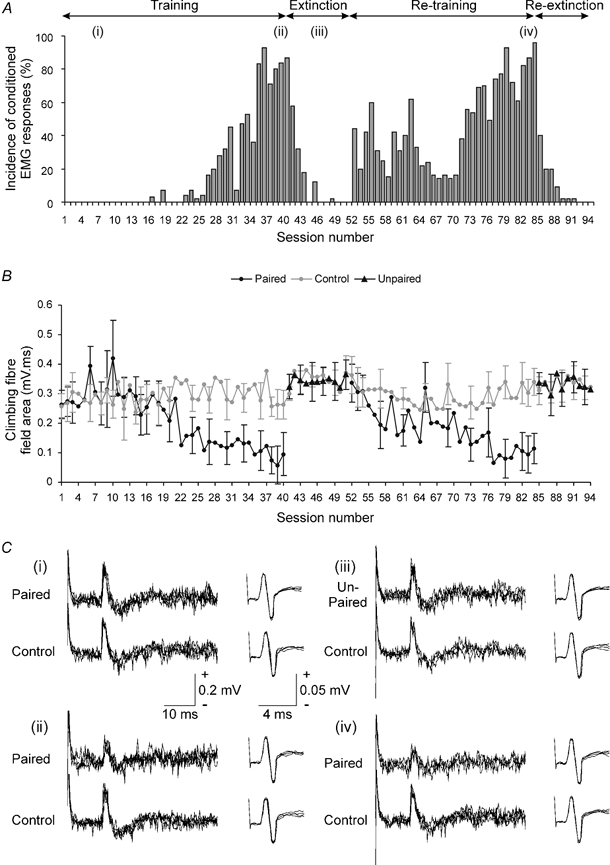
A, bar chart showing the incidence of conditioned EMG responses for each recording session during an initial period of training (animal CE3), followed by a period of extinction and during a period of re-training and re-extinction (based on 45 paired or unpaired trials per session during training and extinction, respectively). Lower-case roman numerals indicate session numbers in which example cerebellar and nerve responses were selected for illustration in C. B, graph plotting the mean area of climbing fibre field potential (± s.d.) evoked at an example cerebellar cortical C3 zone site during the recording sessions shown in A. Mean area of the field evoked in control trials (grey line and circles), paired trials (black line and circles) and unpaired trials (black triangles) is shown (10, 45 and 45 trials per session, respectively). For further details see Methods. C, each set of responses show example C3 zone evoked climbing fibre field potentials (left) and corresponding nerve volley recordings (right; four sweeps superimposed in all traces, US delivered at the start of each trace). The upper and lower records of each set show respectively responses in CS-US (paired or unpaired) and US only (control) trials, obtained (i) early on during training, (ii) after training (iii) during extinction and (iv) after re-training.