
Figure 3. Summary of changes in climbing fibre field size after conditioning.
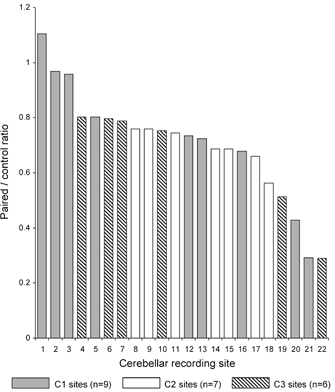
For each of 22 cerebellar paravermal recording sites, bar charts indicate the mean area of the field in CS-US (paired) trials as a ratio of the mean area of the climbing fibre field in the corresponding US only (control) trials. For each site, data are pooled from the last three sessions of a training run (i.e. each ratio is based on 135 paired trials and 30 control trials). Different patterns of shading indicate sites located in the C1 (grey), C2 (white) or C3 (hatched) zones.