
Figure 6. Climbing fibre field facilitations during training.
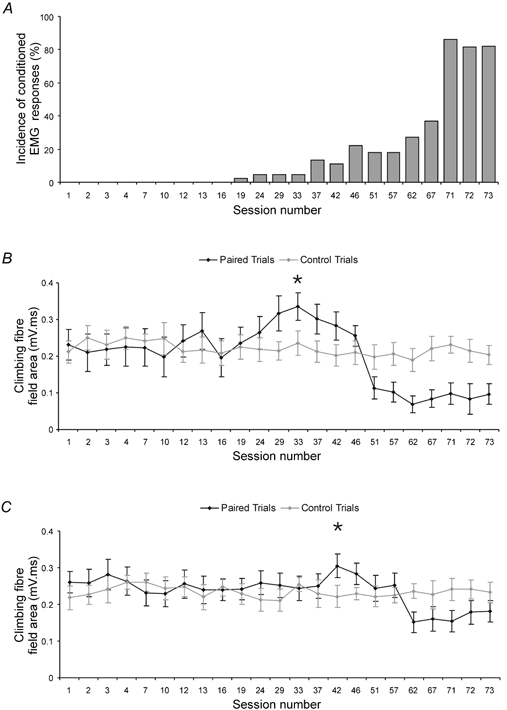
A, acquisition curve (animal CE4) showing the incidence of conditioned EMG responses for each recording session during a training run. B, data from an example recording site (in the C1 zone), plotting for each recording session depicted in A, the mean area (± s.d.) of the climbing fibre field in US only (control) trials (grey line and circles, 10 trials per session) and CS-US (paired) trials (black line and circles, 45 trials per session). C, same as B but for a different C1 zone site recorded simultaneously with the site shown in B. In B and C, an asterisk indicates the session number when fields in paired trials were largest (multiple regression, P ≤ 0.01 in both cases).