
Figure 6. Direct transitions between consecutive open-channel current levels.
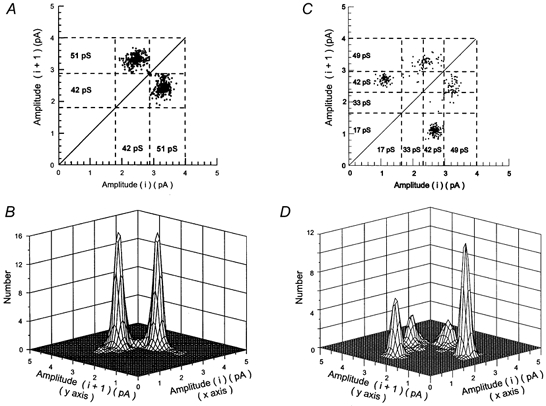
Plots show the number of direct transitions between consecutive open-channel current levels (shut level not included) in outside-out patches containing only high conductance unitary currents (A and B) or high and low conductance unitary currents (C and D). An amplitude-based separation of unitary currents was obtained by calculating critical amplitude values (Acrit) producing an equal percentage of misclassified events between the Gaussian components fitted to the amplitude distribution such as illustrated in Fig. 2C and D. A crit values indicated by the dashed lines in A and C were 2.87 pA in A and 1.71, 2.35 and 3.05 pA in C. In A and C, each dot represents a direct transition, considered as a change in open-channel current level from one amplitude level to another (each amplitude level having a duration longer than 2.5 filter rise times: 415 μs) without intervening closures longer than the shut time resolution (50 μs in these examples). B and D are three-dimensional representations of the data shown in A and C, respectively. The volume of each peak indicates the relative frequency of each type of transition. In the patch illustrated in A and B, 49.2 % of direct transitions between open levels were from 51-42 pS while 50.8 % were from 42-51 pS level. In C and D, 47.5 % of direct transitions between 49 and 42 pS levels were from 49-42 pS while 52.5 % were from 42-49 pS. In contrast, 65.2 % of transitions between 17 and 49 pS levels were from 49-17 pS while only 34.8 % were from 17-49 pS.