
Figure 7. Simulation of the non-linear interactions between GABAAR- and glyR-activated currents.
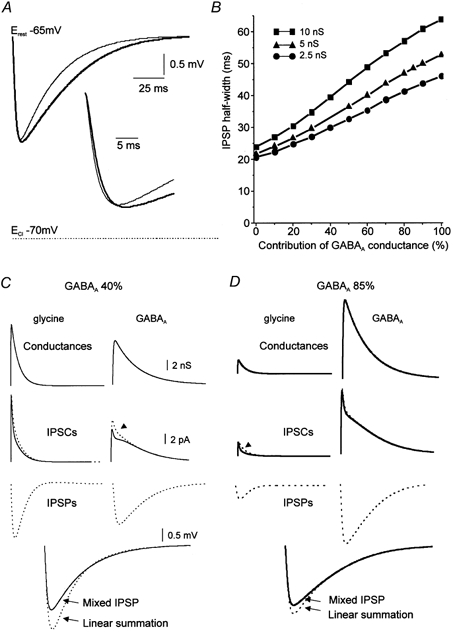
The resting membrane potential is −65 mV and the reversal potential for Cl− is −70 mV. A, time courses of mixed IPSPs depend on the proportion of each component. Thin trace, IPSP with 40 % of GABAAR-activated conductance. Thick trace, IPSP with 85 % GABAAR-activated conductance (maximum of the postsynaptic compound conductance is 5 nS). B, half-width of compound IPSPs as a function of the fractional contribution of GABAAR for three maximal postsynaptic conductances. Modifications of IPSP shape were more limited for small postsynaptic conductances than for large postsynaptic conductances. C and D, comparison of compound IPSPs (continuous lines) and linearly summated IPSPs (dashed lines) for 40 % (C) and 85 % (D) GABAAR-activated conductances (first line). In each case, the compound IPSC can be resolved into a glyR-activated (continuous line, left column) and a GABAAR-activated component (continuous line, right column). The superimposed dashed traces represent the individual IPSCs produced by the same postsynaptic conductance (same number of channels) without the contribution of the complementary currents. In the mixed IPSC, the GABAAR-activated IPSC is reduced by the strong glyR-activated current whereas the glyR-activated current exhibits only a small reduction (arrowhead). Synaptic potentials calculated from these individual IPSCs are shown as dashed traces. Their numerical summation (linear summation) is superimposed on the IPSP resulting from the mixed IPSCs (mixed IPSP). Note that the difference between the continuous and dashed IPSPs is larger for the IPSPs to which GABA and glycine contribute almost equally (C) than for an almost pure GABAAR-mediated IPSP (D).