
Figure 2. ISI histograms and autocorrelograms.
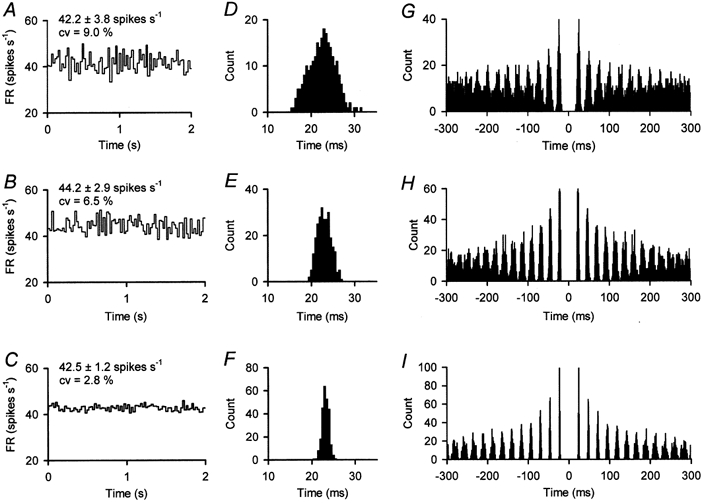
A-C, two second epochs of instantaneous firing rate (FR) in a control (A), a low-dose-treated (B) and a high-dose-treated (C) abducens motoneurone. Stationary epochs were selected as having similar mean firing rate (mean ± s.d. in spikes s−1) across groups. Note, however, from A to C a reduction of both the standard deviation and the coefficient of variation (cv). D-F, ISI histograms from the corresponding cells shown in A-C, but constructed using a 6 s sample (bins of 0.5 ms). All were normal distributions (Kolmogorov-Smirnov test; P > 0.05). G, the control autocorrelogram (1 ms bin size) showed one clear peak and up to 6 other peaks fused at the base (same cell as in A and D). H, the autocorrelogram of the low-dose-treated motoneurone shown in B and E demonstrated a greater regularity than the control motoneurone. It showed 4 non-fused peaks at the base and 6 other fusing peaks. I, the autocorrelogram of the high-dose-treated motoneurone illustrated in C and F showed an extraordinarily predictable conditional probability of spike occurrence.