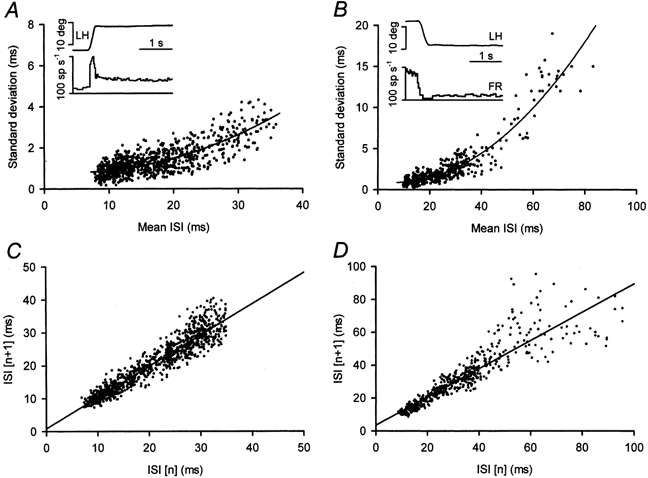
Figure 3. Effect of previous firing on motoneuronal variability.

A, plots of the standard deviation versus the mean ISI of 925 intervals from 49 fixations obtained after on-directed saccades (see inset for an example) in a control motoneurone. The line is the inverse quadratic regression y = 0.846 - 0.022x + 0.002x2 (r = 0.94; P < 0.001). B, same as A, but for 550 intervals from 36 fixations obtained after off-directed saccades analysed in the same motoneurone. The inverse quadratic function was y = 1.033 - 0.042x + 0.003x2 (r = 0.93; P < 0.001). Note larger standard deviations for intervals longer than 40 ms. C, joint ISI plot of the intervals in A; data clustered along the regression line y = 0.81 + 0.95x (r = 0.94; P < 0.001). D, joint ISI plot of the intervals in B; data clustered along the regression line y = 3.56 + 0.87x (r = 0.91; P < 0.001). Also note larger scatter of data for intervals longer than 40 ms.
