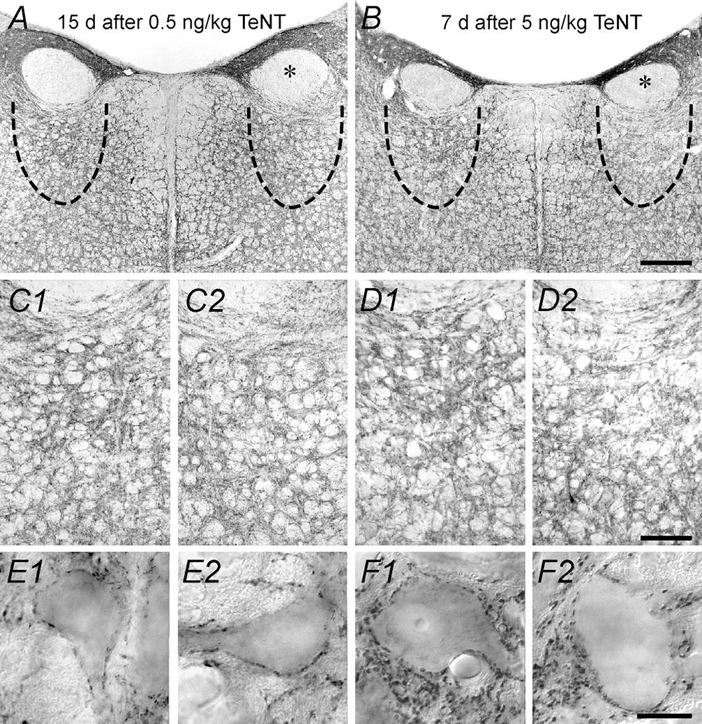
Figure 7. Changes in synaptophysin immunoreactivity in the abducens nucleus.

A, synaptophysin immunoreactivity in a brainstem coronal section from an animal injected 15 days previously with a low dose of TeNT. The asterisk indicates the genu of the facial nerve in the injected side. The approximate location of the abducens nucleus is indicated by a dashed line. B, same as A, but from an animal treated 7 days before with a high dose of TeNT. Calibration bar in B is 500 μm and applies to A. C1 and C2, photomicrographs illustrating details of the abducens nucleus neuropil from the same animal as in A for the control and treated sides, respectively. D1 and D2, same as before, but from the same animal as in B. Calibration bar in D2 is 100 μm and applies to all C and D panels. E1 and E2, high power magnification of cellular somata from the same animal as in A for the control and treated sides, respectively. F1 and F2, high power magnification of cellular somata from the same animal as in B. Calibration bar in F2 is 10 μm and applies to all panels in E and F. Note a reduction in the density of synaptophysin-immunoreactive terminals in the treated side.
