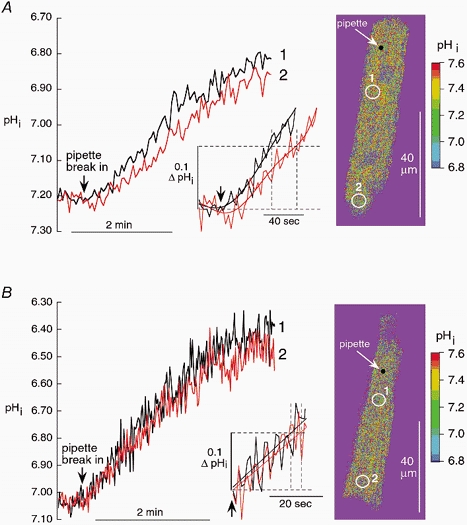
Figure 1. Longitudinal diffusion delay is reduced in CO2/HCO3− buffer.

Acid is diffused into a rabbit myocyte from a patch pipette. Standardized longitudinal positions of pipette and regions of interest (ROIs) are shown in a confocal, calibrated ratiometric SNARF image (right). Distance from pipette to centre of ROI 1: 15 μm; ROI 1 to ROI 2: 40 μm. Main graph shows the time course of acid loading averaged within the ROIs. Inset shows the initial period after break-in at higher amplification. To help identify the arrival time of pHi at the 0.1 threshold, polynomial fits (5th order) were applied to each curve over the first 2.3 min. Dashed lines indicate time delay between the two ROIs estimated at a threshold fall of pHi (ΔpHi) of −0.1 units. A, Hepes-buffered superfusate. B, 5 % CO2/HCO3−-buffered superfusate.
