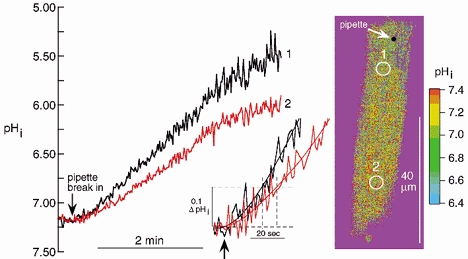
Figure 2. ATZ increases intracellular diffusion delay.

Time course of acid loading averaged within ROIs 1 and 2 plotted in main graph. Calibrated ratiometric image shows standardized longitudinal positions of pipette and the two ROIs (see legend to Fig. 1 for quantitative spacing). Inset shows the initial period after break-in at higher amplification. Continuous lines fitted to traces by computer (8th order polynomial). Dashed lines indicate diffusion delay (at a −0.1 ΔpHi threshold level).
