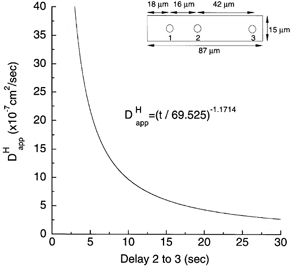
Figure 3. Relationship between inter-ROI time delay and apparent mobility.

Results of the mathematical model of diffusion described in previous paper (Vaughan-Jones et al. 2002). Graph drawn according to the equation: = (delay/69.525)−1.1714. Delay was measured in a model cell (at a 20 nm threshold rise of [H+]i) between points 2 and 3 downstream from a pipette sited at point 1 (see inset for dimensions and point positions of model cell). The relationship is shown for time delays of 2-14 s. The equation was derived empirically from time courses predicted by the model for the rise of acid at sites 2 and 3 (for further details see Fig. 11 of Vaughan-Jones et al. 2002).
