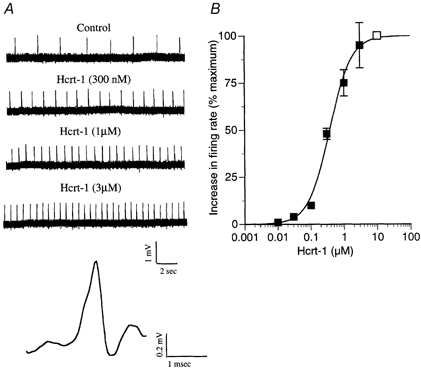
Figure 7. Hypocretin-1 increases firing rate.

A, the effect of different concentrations of hypocretin-1 (Hcrt-1) on the frequency of action potentials in the mouse LC was tested. A positive correlation was found between concentration and spike frequency. A typical spike is shown at the bottom. B, a dose-response curve is shown. The open square at 10 μM is defined as 100 %; a small increase in spike frequency was found with 30 nm hypocretin-1. The number of neurons recorded for each concentration of the dose-response curve were (starting at lowest concentration on left) n = 4, 4, 5, 15, 15, 3.
