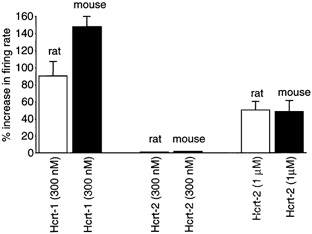
Figure 9. Comparison of rat and mouse LC.

Bar graph showing the relative responses of 51 LC neurons from slices of rat (n = 18 neurons) and mouse (n = 33 neurons), tested in parallel experiments. The responses tend to be similar, with a modest response to hypocretin-2 (Hcrt-2) and a strong response to hypocretin-1 (Hcrt-1).
