
Figure 3. Shift in Clir activation induced by changes in pHo.
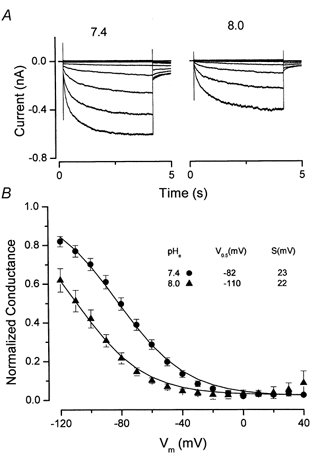
A, cells were bathed in solutions with the pH adjusted to the indicated values. Control currents (pHo = 7.4) are shown in the left-hand panel and test currents are shown in the right-hand panel (pHo = 8.0). Membrane potential was changed from −120 to +40 mV in 20 mV steps. B, voltage dependency of channel activation at pH 7.4 (•, n = 5) and 8.0 (▴, n = 5). The analysis of these curves obtained from paired experiments was as described in Fig. 2B. The resulting average curves were fitted with the Boltzmann function to obtain the parameters V0.5 and s displayed in the inset.