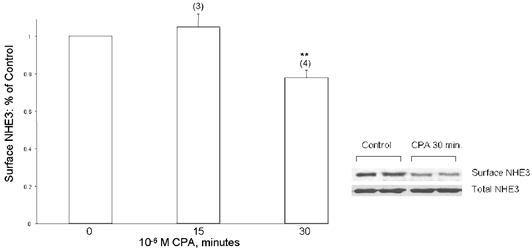
Figure 9. Apical membrane NHE3 protein abundance in response to either 15 or 30 min CPA.

A6/C1 cells transfected with wild-type NHE3 were treated selectively on the basolateral cell surface with 10−6m CPA for the indicated period. Apical surface proteins were biotinylated and retrieved from the solubilised cell lysate by streptavidin-affinity precipitation as indicated in legend of Fig. 8, and NHE3 antigen was quantified by immunoblot. Total NHE3 was quantified by immunoblotting NHE3 from the crude membrane fractions. Graph is a summary of all experiments (number of experiments given in parentheses). Error bars indicate means and s.e.m. * P < 0.05 compared with control (vehicle-treated cells). The inset is a typical blot from an experiment where effect of CPA (10−6m, 30 min) on surface NHE3 abundance was studied (upper panel) and compared with change of total NHE3 within the experimental period (lower panel).
