
Figure 7. Consequences of increasing the initial RRP size on simulated STD.
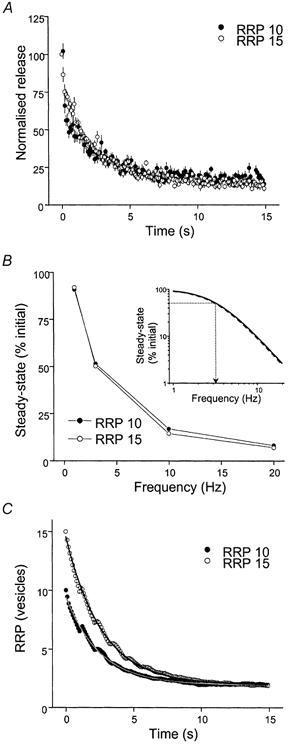
A, change in release during 10 Hz simulation for control terminals (10 vesicles in the RRP, •) and terminals in which the initial RRP size was increased to 15 vesicles (○). Control steady state = 13.4 ± 0.4 %; RRP15 steady state = 12.6 ± 0.6 %. B, frequency dependence of the steady-state level of release during simulated STD with 10 (•) and 15 (○) vesicles in the RRP. Inset, fit of control (continuous line) and RRP 15 data (dashed line) with a Lorentzian function. The dotted line indicates the frequency resulting in 50 % depression. C, mean number of vesicles in RRP during simulated STD with 10 (•) and 15 (○) vesicles in RRP. Exponential fits of the data for 10 (continuous line) and 15 vesicles in the RRP (dotted line) are shown in A (double) and C (single).