
Figure 1. Mechanically dissociated SDCN neurons and the method for detection of sIPSCs.
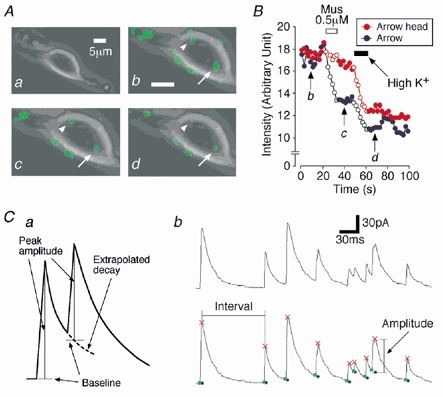
A, representative photographs of a mechanically dissociated SDCN neuron before loading FM 1-43 (a), after loading FM 1-43 (b), after application of 0.5 μM muscimol (c) and after application of 20 mm K+ solution (d). In b, c and d, the fluorescence signals were superimposed on a. B, typical time courses of the fluorescence intensities of two presynaptic nerve terminals during application of muscimol or high K+ solution. Red and blue points were analysed from arrowhead and arrow in A, respectively. Open circles represent periods during the drug application. C, schematic illustration of the sIPSC detection method (a), and a typical trace of sIPSCs at expanded time scale (upper) and its detection result (lower) (b). Red: peak of events; green: onset; blue: calculated baseline.