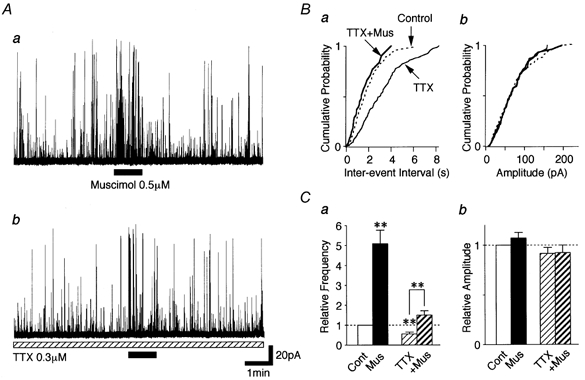
Figure 6. Muscimol-induced sIPSC facilitation in the presence of TTX.

A, typical traces of glycinergic sIPSCs observed before, during and after adding 0.5 μM muscimol to a standard solution (a), and in the presence of 0.3 μM TTX (b). Both traces were obtained from the same neuron. B, cumulative probability plots for the inter-event interval (a; P < 0.01) and amplitude (b; P = 0.41) of sIPSCs shown in A; 458 events for the control, 346 events for TTX and 61 events for TTX plus muscimol were plotted. C, each bar is the mean of 8 neurons and normalized to the control. ** P < 0.01.
