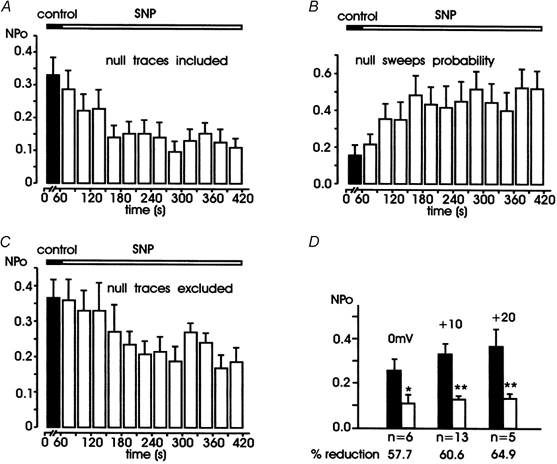
Figure 2. Mean NPo and null sweeps probability versus time before and during SNP application.

Filled bars are data in control conditions obtained by averaging data collected during 1 min of recording from 13 patches. Open bars are values during SNP application obtained at intervals of 30 s (A-C) or by grouping all the values from the third to the sixth minute (D). In A-C, depolarizations were at +10 mV. A shows the mean NPo calculated including the null sweeps (see Methods) and B shows the probability of null sweeps versus time. Notice the marked decrease of NPo and the almost threefold increase of null sweeps probability with time. C shows the values of NPo calculated by excluding the null sweeps from the analysis. NPo decreased from 0.37 ± 0.05 to 0.21 ± 0.01 with a 43.2 % reduction with respect to controls, P < 0.05. D shows the mean values of NPo at 0, +10 and +20 mV in control conditions and during SNP application, with the percentage of reduction indicated below (* P < 0.05, ** P < 0.01). The difference between minimal and maximal reduction (57.7 vs. 64.9 %) was not statistically significant (P > 0.05).
