
Figure 7. Voltage dependence of taurine transport reversal.
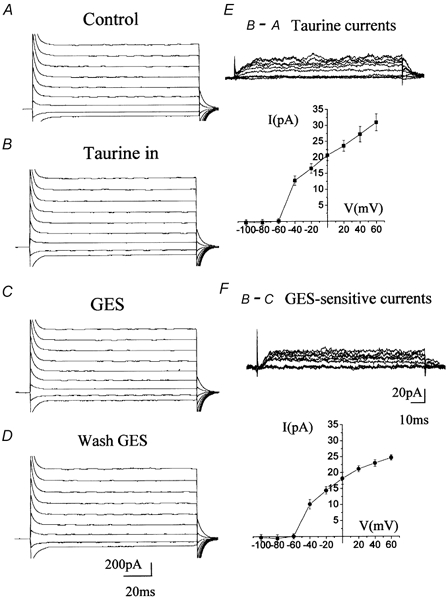
Voltage step records for taurine efflux. A, B, C and D, current traces following 20 mV increment voltage steps of 150 ms applied from −100 to +0 mV from a holding potential of −70 mV under control conditions (A) and after intracellular perfusion of 20 mm taurine (B). Following intracellular taurine perfusion, the cells were recorded in the presence of GES (C) and following washout of GES (D). E, traces in A were subtracted from traces in B to reveal taurine efflux currents (top panel) and their respective I-V curve (lower panel). F, traces in C were subtracted from traces in B to illustrate the effect of GES and its magnitude by showing the respective I-V curve (lower panel). All these experiments were performed in the presence of GABAA/B/C receptor and GLY receptor blockers.