
Figure 1. Changes in threshold (A), supernormality (B) and τSD (C) in median sensory and motor axons before, during and after ischaemia for 13 min.
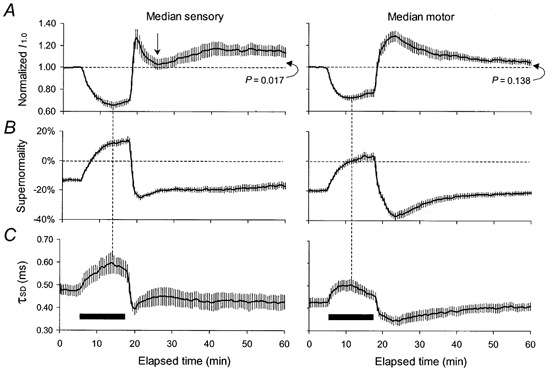
Mean data for 8 subjects (± s.e.m.). The duration of ischaemia is indicated by the filled horizontal bars, starting at 5 min. A, threshold changes measured using 1.0 ms test stimuli normalized to the pre-ischaemic values for median sensory axons (left column) and median motor axons (right column). B, supernormality, expressed as the decrease in threshold for the conditioned potential as a percentage of the unconditioned threshold when the conditioning-test interval was 7 ms. C, τSD, calculated off-line using unconditioned test stimuli of 0.1 and 1.0 ms duration. At 60 min (i.e. 42 min after the release of ischaemia), threshold was still significantly greater than the pre-ischaemic level for sensory axons but not for motor axons. Note that the ‘notch’ on the sensory threshold (indicated by the vertical arrow) is associated with appropriate changes in τSD and, less obviously, supernormality.