
Figure 2. Relationships of supernormality and τSD to normalized threshold for sensory and motor axons during and after ischaemia.
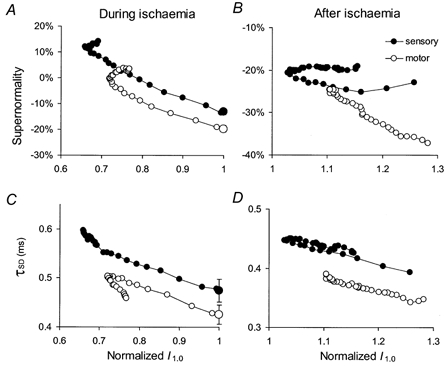
Mean data from Fig. 1B and C for median sensory (•) and median motor (○) axons are plotted against the normalized threshold (from Fig. 1A) during ischaemia (left column) and for 15 min after the peak in the post-ischaemic period (right column). The pre-ischaemic values are indicated by the large symbols at the threshold of unity (mean ± s.e.m.) in A and C. Apart from the baseline shift, the relationships for sensory and motor axons are generally similar, except in B, where the relationship for the sensory axons is less steep than for motor axons. In B and D, the threshold changes for sensory axons reflect the transient notch (indicated by the arrow in Fig. 1A) during which threshold rose to a peak, decreased then increased again.