
Figure 3. Responses to continuous depolarizing and hyperpolarizing current ramps.
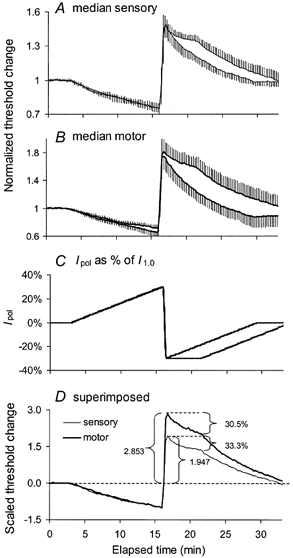
Mean data for 6 subjects (± s.e.m.). A, normalized threshold changes for median sensory axons in response to the two polarizing current profiles shown in C. B, median motor responses to the polarization in C. The polarizing sequences had the same depolarizing ramp to a maximum of 30 % of I1.0, but different hyperpolarization ramps, one decaying immediately from peak hyperpolarization (30 % of I1.0), the other holding that level for 5 min before decaying to zero. D, superimposition of the mean responses to sustained hyperpolarization in A and B after scaling so that the extent of depolarization was 1.0 for sensory and motor axons. Note that equivalently strong currents produced much greater threshold increases than threshold decreases, and that this was particularly so for motor axons.