
Figure 4. Responses to continuous depolarizing and hyperpolarizing currents ramps that were the same percentage of Irh.
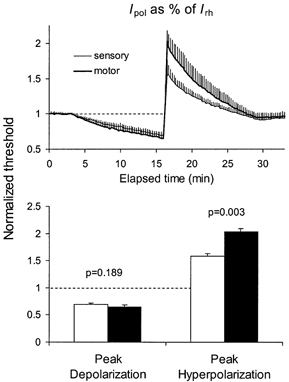
Mean data of 6 subjects (± s.e.m.). For each subject, Irh was calculated for sensory and for motor axons from the thresholds measured prior to polarization using stimuli of 0.1 and 1.0 ms duration. The applied polarizing currents were maximally ±50 % of these rheobasic values. There was no significant differences in the maximal threshold reduction produced by the depolarizing ramps but the threshold increases to hyperpolarizing current was much greater for motor axons. Open histograms: normalized thresholds for sensory axons; filled histograms: normalized thresholds for motor axons.