
Figure 8. Responses of sensory axons of different threshold to ischaemia for 2, 5 and 10 min.
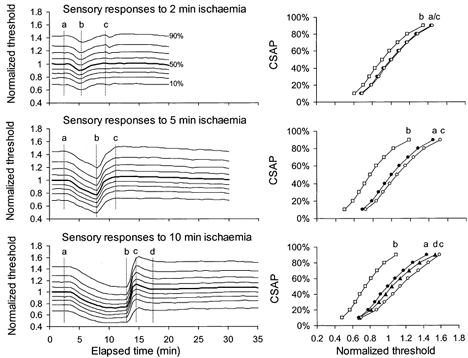
Mean data for 6 subjects, averaged after normalization to the 50 % threshold (thick line). Threshold changes during and after ischaemia for 2, 5 and 10 min all showed a uniform pattern of behaviour for axons of different threshold. Stimulus-response curves at time intervals a, b, c and d are plotted in the right panels.