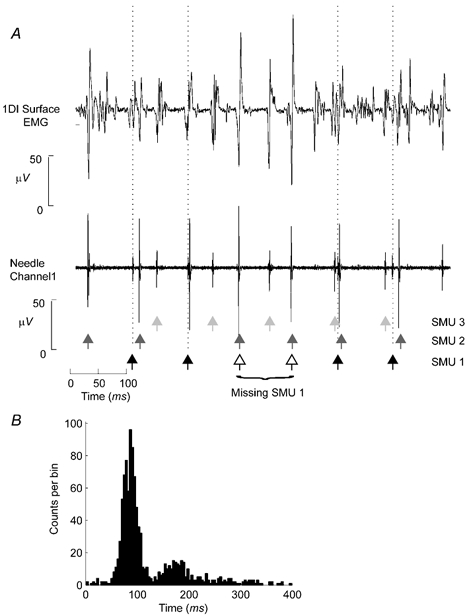
Figure 1. Synchronous bursting of 1DI SMUs during precision grip.

A, top panel, a section of surface EMG activity from the 1DI muscle during the HOLD2 period of the task. The bottom panel shows the corresponding section of one of the raw needle electrode channels. The dashed vertical lines indicate the time of discrimination for one of the SMUs discriminated from this electrode. The time of discharge of this SMU is also indicated by the black arrows. The dark and light grey arrows show the times of discrimination of two other discriminated SMUs. The open arrows show the time that would have been expected for discrimination of SMU1 based on its average firing rate over the entire task. For this section of data SMU1 would have been expected to fire twice. B, the ISIH for the unit identified by the black arrows in A. Note that there is a clear peak around intervals of ≈80 ms, reflecting the firing rate of the unit at 11 Hz, but also a sub-peak around 180 ms (5.5 Hz) as a result of missed units in the discrimination process, as shown by the open arrows in A.
